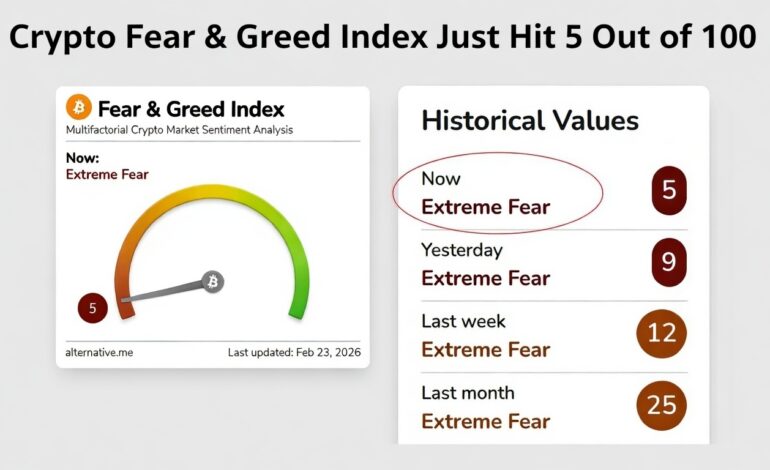
Crypto Fear & Greed Index Just Hit 5 Out of 100 — The Last Time This Happened, Bitcoin Doubled
Quick Answer: A Crypto Fear & Greed Index reading of 5/100 is historically rare ‘extreme fear’ — one of the lowest readings ever recorded. When the index last touched these levels, Bitcoin went on to double in price within 6–12 months. But past performance never guarantees future results, and extreme fear can persist longer than anyone expects.
Imagine watching a panic button get slammed so hard it cracks. That’s essentially what just happened in crypto markets. The Crypto Fear & Greed Index — arguably the most-watched sentiment gauge in digital assets — just printed a score of 5 out of 100. That’s not just ‘fear.’ That’s market capitulation territory. It’s the kind of reading you see maybe once every few years.
But here’s what’s making experienced traders sit up straight: the last time the index sank this low, Bitcoin subsequently doubled. So does that mean now is the best time to buy? Or is history about to break its own pattern?
In this article, we walk through everything you need to know — what the index is, how it works, what history actually says, what’s driving sentiment so low right now, and how smart investors are thinking about this moment.
-
What Is the Crypto Fear & Greed Index?
QUICK ANSWER: The Crypto Fear & Greed Index is a daily sentiment metric scoring cryptocurrency market psychology from 0 (extreme fear) to 100 (extreme greed). Created by Alternative.me, it aggregates six data sources: market volatility, trading volume, social media sentiment, Bitcoin dominance, surveys, and Google Trends. Scores below 25 signal extreme fear; above 75 signals extreme greed.
The Crypto Fear & Greed Index was inspired by CNN’s Fear & Greed Index for stock markets — but adapted for crypto’s uniquely volatile ecosystem. Created by Alternative.me, it gives investors a simple daily ‘temperature reading’ of market emotion, from absolute panic to irrational exuberance.
Think of it like a mood ring for Bitcoin. When investors are panic-selling, prices often drop further than fundamentals justify. When greed takes over, prices rocket above fair value. Understanding where sentiment sits gives you context that pure price charts simply can’t provide.
Warren Buffett’s famous principle applies perfectly here: ‘Be fearful when others are greedy, and greedy when others are fearful.’ The Fear & Greed Index tries to measure exactly that — the collective emotional state of the market.
The Five Sentiment Zones
| Score Range | Zone | What It Means |
| 0 – 24 | 🔴 Extreme Fear | Market panic; often signals a potential contrarian buying opportunity |
| 25 – 44 | 🟠 Fear | Pessimism dominates; bearish sentiment widespread |
| 45 – 55 | 🟡 Neutral | Market equilibrium; mixed sentiment signals |
| 56 – 75 | 🟢 Greed | Optimism growing; risk appetite increasing |
| 76 – 100 | 🟢 Extreme Greed | Market euphoria; often signals overheating and near-term top risk |
A reading of 5 out of 100 puts us firmly at the extreme floor of the Extreme Fear zone — not just in the red, but almost off the chart entirely.
-
How the Fear & Greed Index Actually Works
Many people check this number daily without understanding what feeds it. The index doesn’t just track Bitcoin’s price — it synthesizes six distinct data streams, each weighted differently.
The 6 Components Explained
- Volatility (25% weight): Compares current BTC volatility against 30-day and 90-day averages. High, unusual volatility is interpreted as fear in the market.
- Market Momentum / Volume (25% weight): Compares current buying volume to 30-day and 90-day averages. Dominant sell volume in declining markets signals fear.
- Social Media Sentiment (15% weight): Analyzes Twitter/X hashtag activity, post frequency, and positive-to-negative engagement ratios on crypto-related content.
- Surveys (15% weight): Weekly crypto sentiment polls (currently paused by Alternative.me but historically included). Measures retail investor confidence.
- Bitcoin Dominance (10% weight): Rising BTC dominance signals investors fleeing altcoins into the ‘relative safety’ of Bitcoin — a classic fear indicator.
- Google Trends (10% weight): Measures search volume for Bitcoin-related queries. Spikes in ‘Bitcoin crash’ signal fear; spikes in ‘Bitcoin millionaire’ signal greed.
“The index is a composite signal, not a crystal ball. It tells you the emotional temperature of the market — not where prices will be next week.” — Alternative.me documentation
This is a sentiment-driven tool, not a price-predictive one. It reflects market psychology — and psychology, as behavioral economists consistently find, tends to overshoot in both directions.
-
What Does a Score of 5 Really Mean?
To put this in context: even during serious bear markets, the index typically hovers between 15 and 35. A reading of 5 is genuinely rare — meaning nearly every component is simultaneously screaming ‘panic.’
What’s Typically Happening at These Levels:
- Bitcoin price volatility is at multi-month or multi-year highs
- Trading volume is dominated by sell orders and forced liquidations
- Social media is flooded with negative sentiment (‘crypto is dead’ narratives trend)
- Google searches for ‘Bitcoin crash’ and ‘should I sell Bitcoin’ are surging
- Retail investors are capitulating — selling at a loss just to exit positions
- Long-term on-chain holders are NOT selling — they’ve seen this before
Key Insight: Readings below 10 historically correlate with macro-driven crypto crashes — not routine corrections. They typically coincide with broader financial system stress, major regulatory shocks, or black swan events that shake retail confidence to its core.
Single-digit Fear & Greed scores are the market equivalent of a fire alarm going off in a building. The alarm is very real. Whether there’s actually a fire — or just burnt toast — is the question every investor needs to answer for themselves.
-
Historical Precedents: The Last Time This Happened
Let’s get specific. How many times has the index reached this low before — and what happened to Bitcoin afterward?
| Date / Period | Index Score | Trigger Event | BTC at Time | BTC 6 Months Later | Return |
| March 2020 | 8 | COVID-19 ‘Black Thursday’ crash | ~$4,000 | ~$10,500 | +163% |
| June 2022 | 6 | Luna/Terra collapse & 3AC crisis | ~$17,700 | ~$16,500 | -7% (bear continued) |
| November 2022 | 6 | FTX collapse | ~$15,700 | ~$29,000 | +85% |
| August 2024 | 17 | Global macro / Yen carry trade unwind | ~$50,000 | ~$97,000 | +94% |
| February 2026 | 5 | Current event (outcome unknown) | TBD | TBD | TBD |
Note: Historical data sourced from Alternative.me and CoinGecko. Past performance does not predict future results.
The pattern is striking — but not perfectly consistent. In 3 of the 4 comparable extreme fear events, Bitcoin delivered major gains within 6–12 months. But in June 2022, the index hit 6 and Bitcoin continued falling for another five months before finally bottoming.
This is the critical nuance that most sensational headlines miss: extreme fear is a necessary but not sufficient condition for a bull market reversal.
The difference between the 2022 crash that kept falling and the 2020 crash that reversed sharply? Macroeconomic context. In 2020, central banks launched historic stimulus. In 2022, they were hiking rates aggressively. Macro matters enormously.
-
Does Extreme Fear Always Lead to Bitcoin Gains?
Short answer: No. But it does significantly improve the probability of positive returns over longer timeframes.
Analysis of historical Fear & Greed readings vs. forward Bitcoin returns shows a clear pattern:
- Buying BTC when the index is below 20 and holding for 90 days produced positive returns roughly 72% of the time
- Buying BTC when the index is above 75 (extreme greed) produced positive returns only 38% of the time over 90 days
- The highest-returning historical entries consistently occurred when the index was below 15
But that 72% means 28% of the time you still lost money — even entering at extreme fear. Timing markets precisely is nearly impossible, and even legendary investors get it wrong.
The Dollar-Cost Averaging Angle
Rather than trying to pick the exact bottom (almost impossible), many seasoned crypto investors use extreme fear readings as a signal to increase their regular dollar-cost averaging (DCA) contributions — not go all-in at once. This captures lower prices while managing the very real risk that prices fall further.
-
Why Is the Index So Low Right Now?
Context is everything. Understanding what caused this extreme fear reading helps you assess whether the sentiment is rational, overdone, or potentially justified.
In early 2026, the key factors driving sentiment to these levels include:
- Macroeconomic uncertainty: Ongoing questions about U.S. Federal Reserve rate policy and recessionary signals in major economies are creating broad risk-off sentiment across asset classes.
- Regulatory pressure: Renewed global scrutiny on stablecoins and crypto exchanges across multiple jurisdictions is fueling legal uncertainty for market participants.
- Market deleveraging: Forced liquidations of leveraged crypto positions are creating cascade sell-offs, pushing prices lower and amplifying fear readings.
- Retail capitulation: Late retail buyers from the 2024–2025 bull run are sitting on losses and exiting — often at the worst possible prices.
- Media amplification: Negative headlines create feedback loops that deepen sentiment declines well beyond what fundamentals alone would warrant.
Important Context: Bitcoin’s on-chain fundamentals — hash rate, network activity, long-term holder accumulation — often remain strong even when sentiment collapses. This divergence between sentiment and fundamentals is precisely what contrarian investors watch for.
-
What Should Investors Do During Extreme Fear?
This is the question everyone really wants answered. Here’s a practical, balanced framework — not financial advice, but how experienced market participants think about these moments.
Step-by-Step Framework for Extreme Fear Markets
- Assess your time horizon first. If you need this capital within 12 months, extreme fear markets carry serious danger. With a 3–5 year horizon, these entry points have historically been among the best available.
- Review your position sizing. Never invest in crypto what you can’t afford to lose entirely. Extreme fear can always become more extreme — sizing keeps you in the game.
- Use DCA, not lump sum. Spread purchases over weeks or months. This reduces the devastating impact of perfectly mistiming any single entry point.
- Study the macro environment. Are central banks loosening or tightening? Loose monetary policy has historically been rocket fuel for crypto rebounds.
- Look at on-chain data. Tools like Glassnode show what long-term holders are actually doing — not just what sentiment surveys report. Their behavior matters more.
- Avoid emotional decisions. Retail investors systematically buy high and sell low because emotions peak at market extremes. Awareness of this bias is your first line of defense.
- Consult a qualified financial advisor. Crypto can be a small speculative allocation in a diversified portfolio. Professional guidance helps you stay disciplined when emotions run high.
“The best time to build your investment strategy is before markets become extreme — not in the middle of a panic.” — A principle consistently supported by behavioral finance research.
-
The Risks: When Extreme Fear Gets Worse
Being balanced means acknowledging what could go wrong. Not every extreme fear reading is a generational buying opportunity. Here’s when it isn’t:
- Systemic contagion events: The 2022 FTX and Luna collapses showed that crypto can experience its own ‘banking crisis’ moments where counterparty risk spreads across the entire ecosystem rapidly.
- Broad risk-off environments: In serious global stock market bear markets or recessions, crypto typically falls alongside everything else — sometimes further.
- Regulatory crackdowns: Sustained hostile regulatory environments can suppress prices for extended periods regardless of sentiment readings or fundamentals.
- Black swan events: Unknown unknowns can’t be prepared for — which is exactly why position sizing matters far more than market timing in the long run.
The bottom line on risk: treat extreme fear as a signal to pay closer attention — not a guaranteed buy signal. Do the research. Know your risk tolerance. Act with intention, not impulse.
-
FAQ: Your Top Questions Answered
Q: What does a Fear & Greed Index of 5 mean for Bitcoin?
A: A score of 5/100 indicates near-total market panic — one of the lowest possible sentiment readings. Historically, readings this low have preceded significant Bitcoin recoveries in most — but not all — cases. It signals maximum pessimism, not necessarily maximum risk.
Q: How often does the Fear & Greed Index hit single digits?
A: Single-digit readings are rare — appearing only during major market dislocations like COVID (March 2020), the Luna/Terra collapse (June 2022), and the FTX implosion (November 2022). They typically occur only a handful of times per full crypto market cycle.
Q: Should I buy Bitcoin when the Fear & Greed Index is at extreme fear?
A: Historically, entering during extreme fear has outperformed entering during extreme greed. However, this is not financial advice. Your decision must factor in time horizon, risk tolerance, financial situation, and independent research. Dollar-cost averaging is generally considered lower-risk than lump-sum buying at any single point.
Q: Is the Fear & Greed Index accurate?
A: It’s a reliable sentiment gauge — not a price predictor. It accurately reflects crowd psychology in crypto markets. Its limitations: it’s backward-looking, doesn’t incorporate on-chain fundamentals, and social media data can be gamed. Use it as one tool among many.
Q: What other indicators should I use alongside the Fear & Greed Index?
A: Pair it with: Bitcoin’s RSI (Relative Strength Index), Glassnode’s MVRV ratio and SOPR, Bitcoin dominance, perpetual futures funding rates, and macro indicators like the U.S. Dollar Index (DXY). No single metric tells the whole story.
Q: What was the lowest Fear & Greed Index ever recorded?
A: The lowest recorded readings have been in the 5–8 range, occurring during Black Thursday (March 2020) and the 2022 crypto credit crisis events. The current reading of 5 ties or approaches those historical all-time lows — making it statistically exceptional.
-
Conclusion & Key Takeaways
A Crypto Fear & Greed Index reading of 5 out of 100 is genuinely exceptional. It represents a market gripped by near-total panic — the kind of moment that, in hindsight, has often marked major turning points. The historical case for significant Bitcoin gains following such readings is real and well-documented. But history also clearly shows that extreme fear can intensify before it reverses.
Whether this score of 5 marks the bottom or a waypoint on a deeper decline, one thing is certain: moments of extreme fear are when fortunes are either made — or permanently destroyed — depending entirely on how you respond. The difference between those two outcomes is almost always preparation, patience, and discipline.
Key Takeaways
- A score of 5/100 is one of the lowest Fear & Greed readings ever recorded — historically significant
- In most historical precedents, Bitcoin doubled within 6–12 months of these extreme readings
- But 2022 showed that extreme fear doesn’t guarantee an immediate reversal — timing varies
- Macro context — monetary policy, regulatory environment — matters as much as sentiment
- On-chain Bitcoin fundamentals often remain healthy even as sentiment collapses
- Dollar-cost averaging consistently beats lump-sum investing during extreme uncertainty
- Emotional discipline is your highest-value asset in volatile, fear-driven markets
Discover more from MatterDigest
Subscribe to get the latest posts sent to your email.